Close collaboration with our magazine team prioritized editorial and visual richness to create clear and impactful data stories.
Morningstar’s unique depth and breadth of intellectual property challenged design to invent new ways to visualize data.
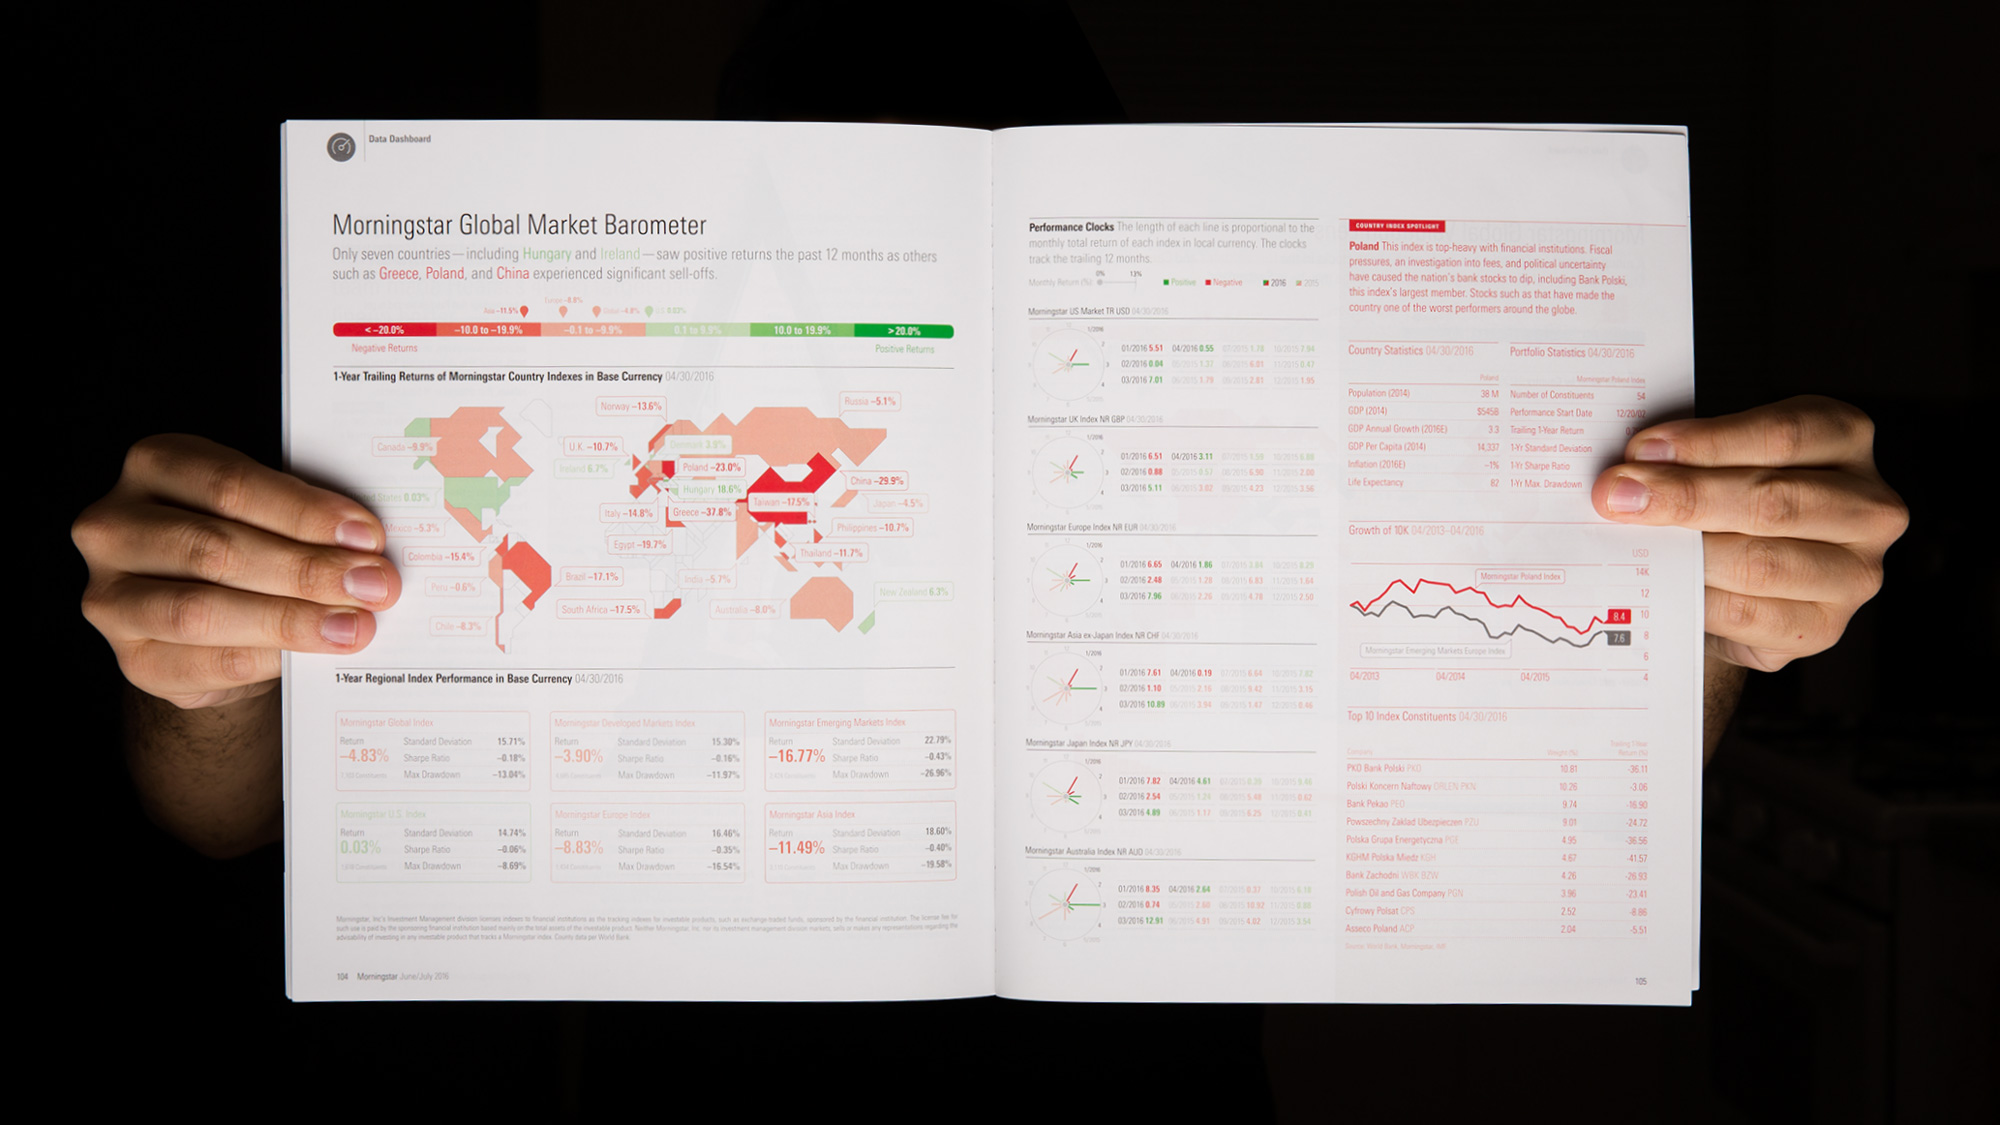
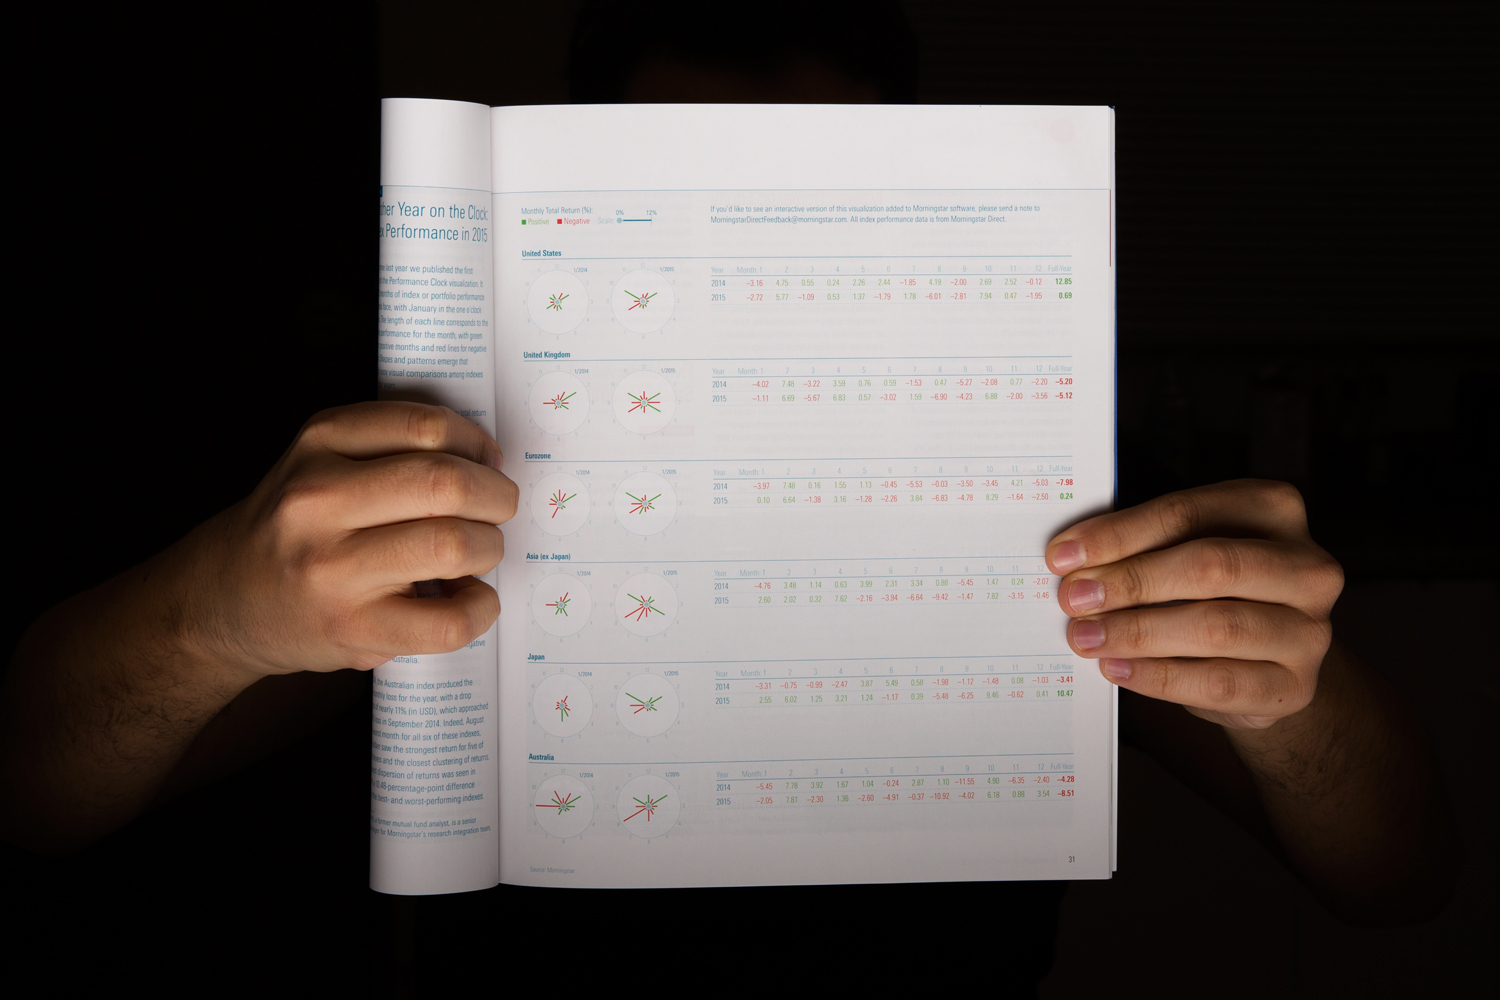
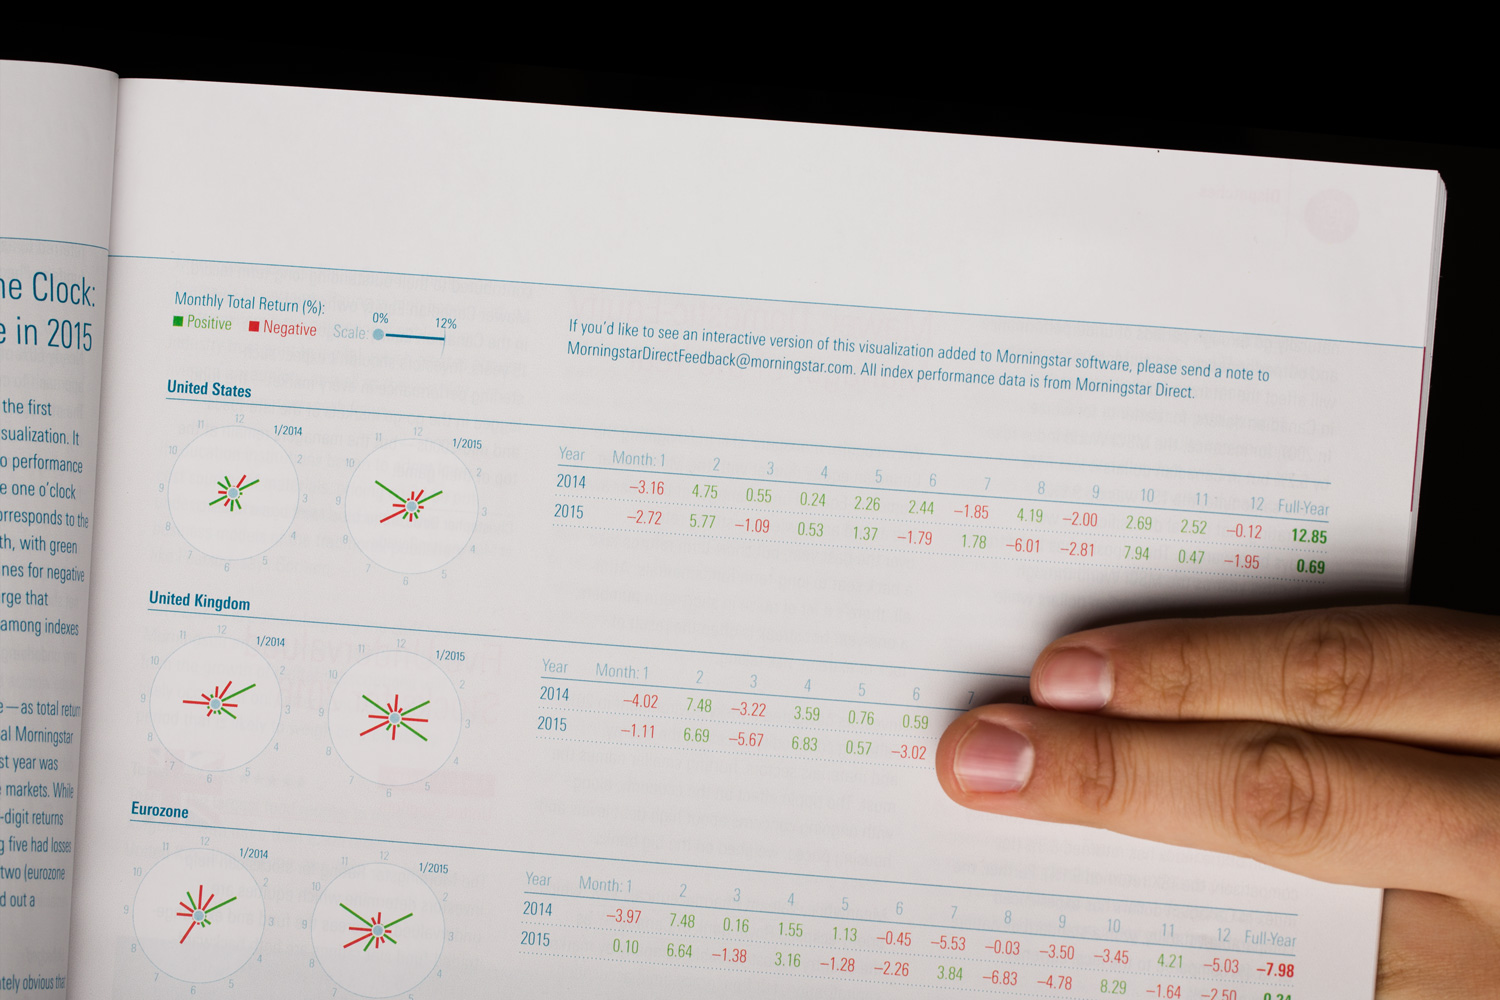
Market Barometer tracks the performance of our country-specific indexes.
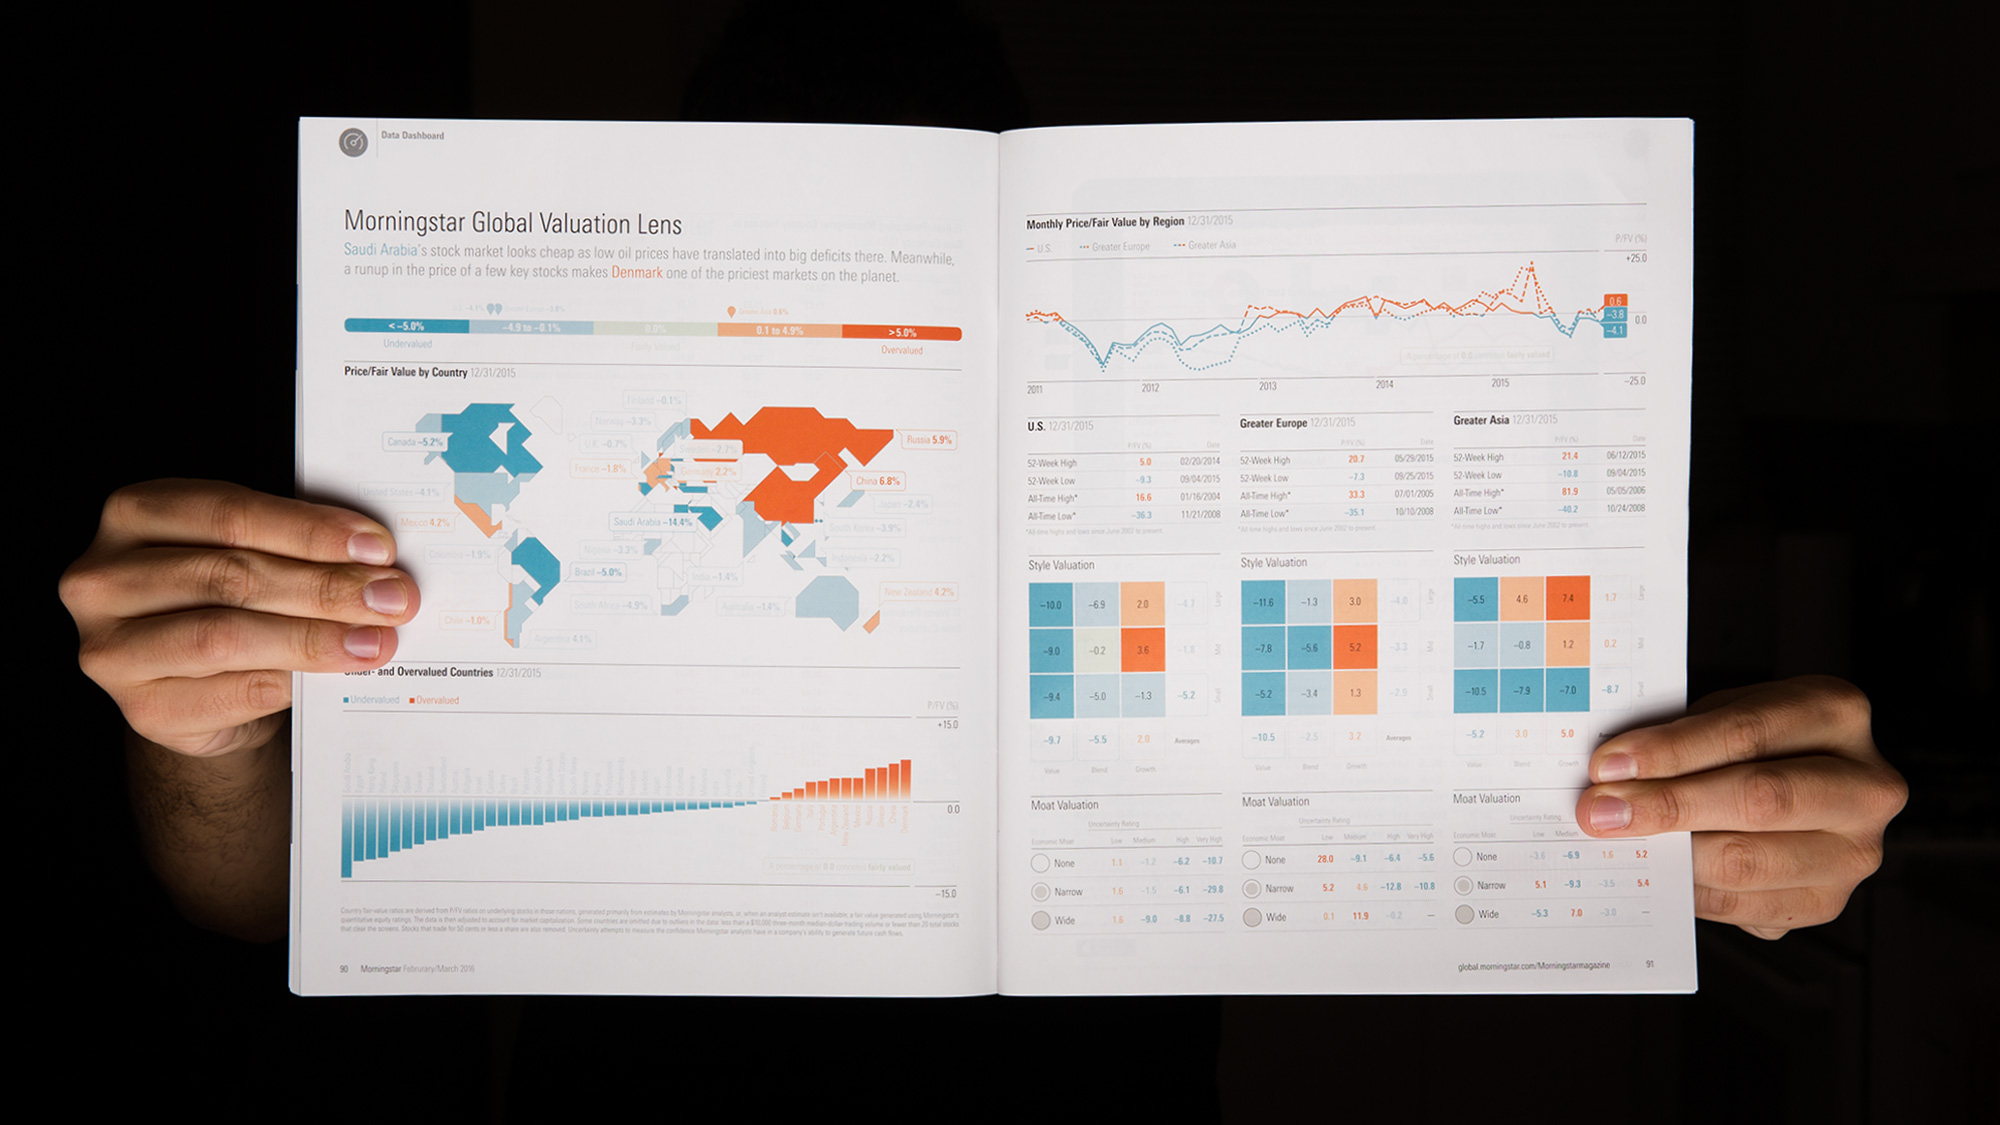
Valuation Lens aggregates our equity analysts’ proprietary price-to-fair value ratios.
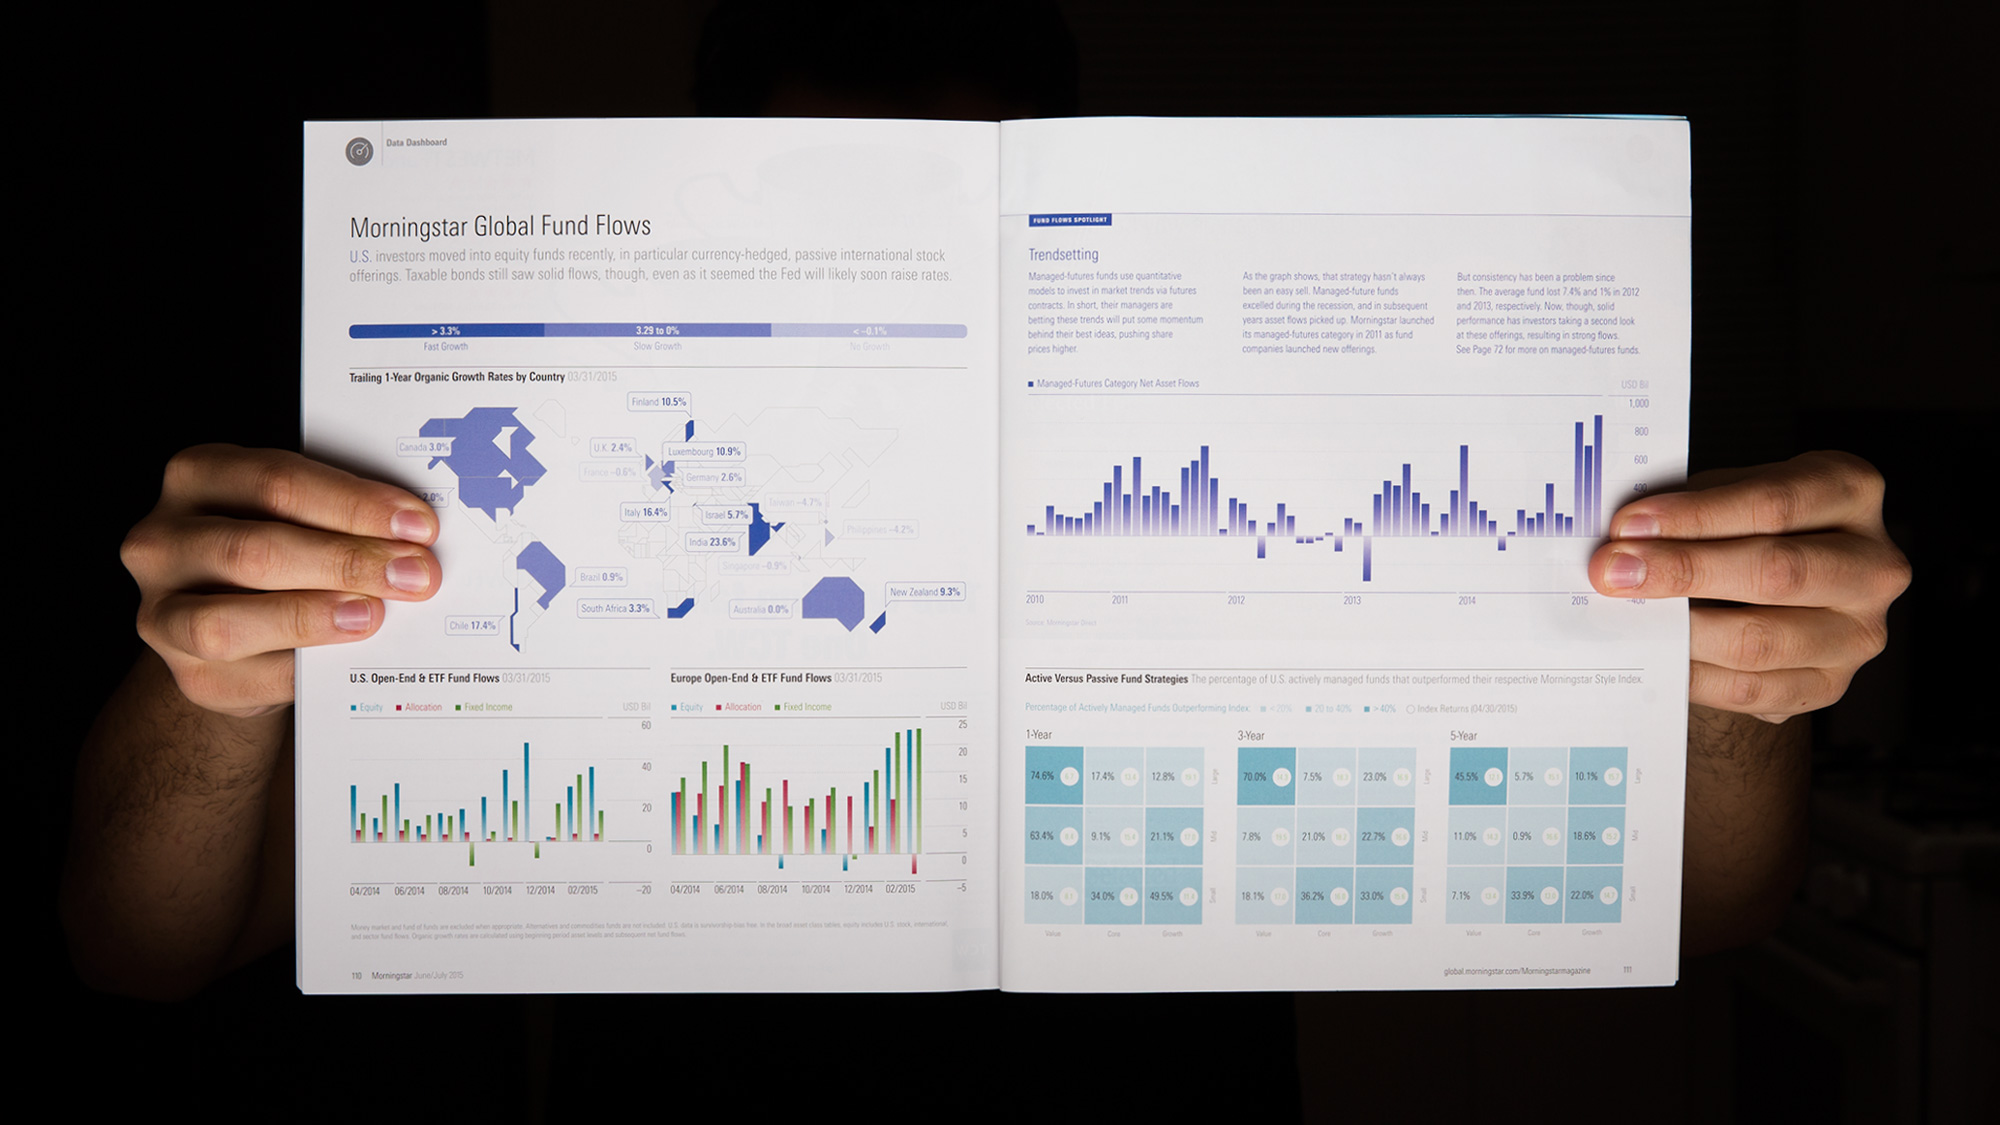
Fund Flows follows worldwide trends of actively-managed investments.
Using the familiar face of a clock, we graphed regional monthly-returns to the twelve ticks. The starburst shape allow for immediate trends to emerge while small multiples of the form allows for seamless comparisons.
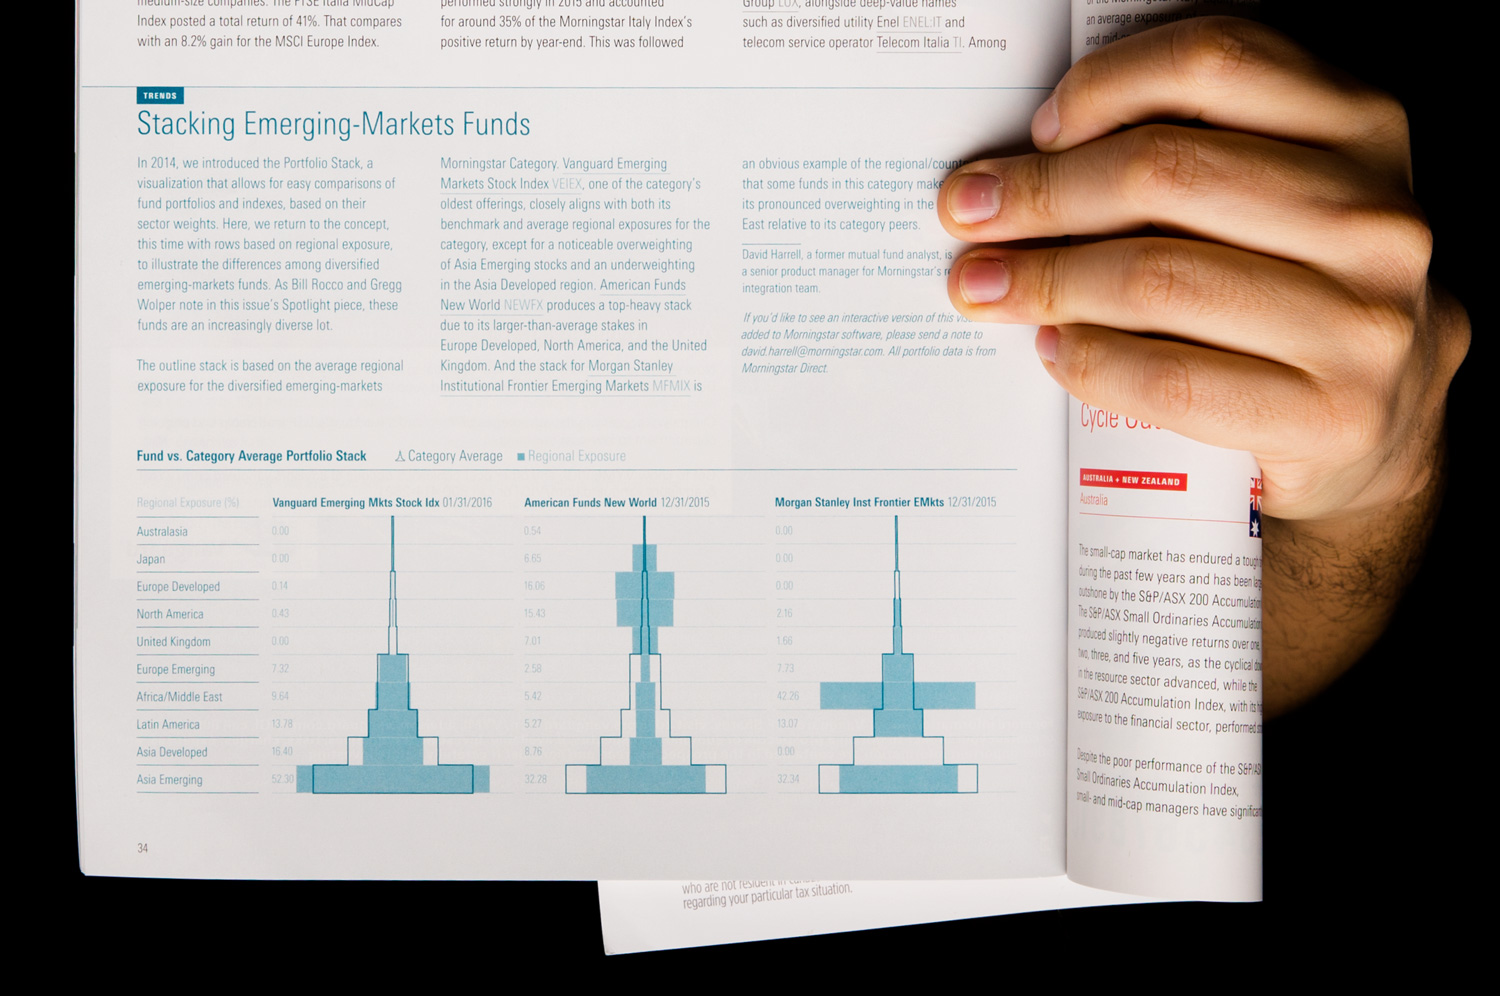
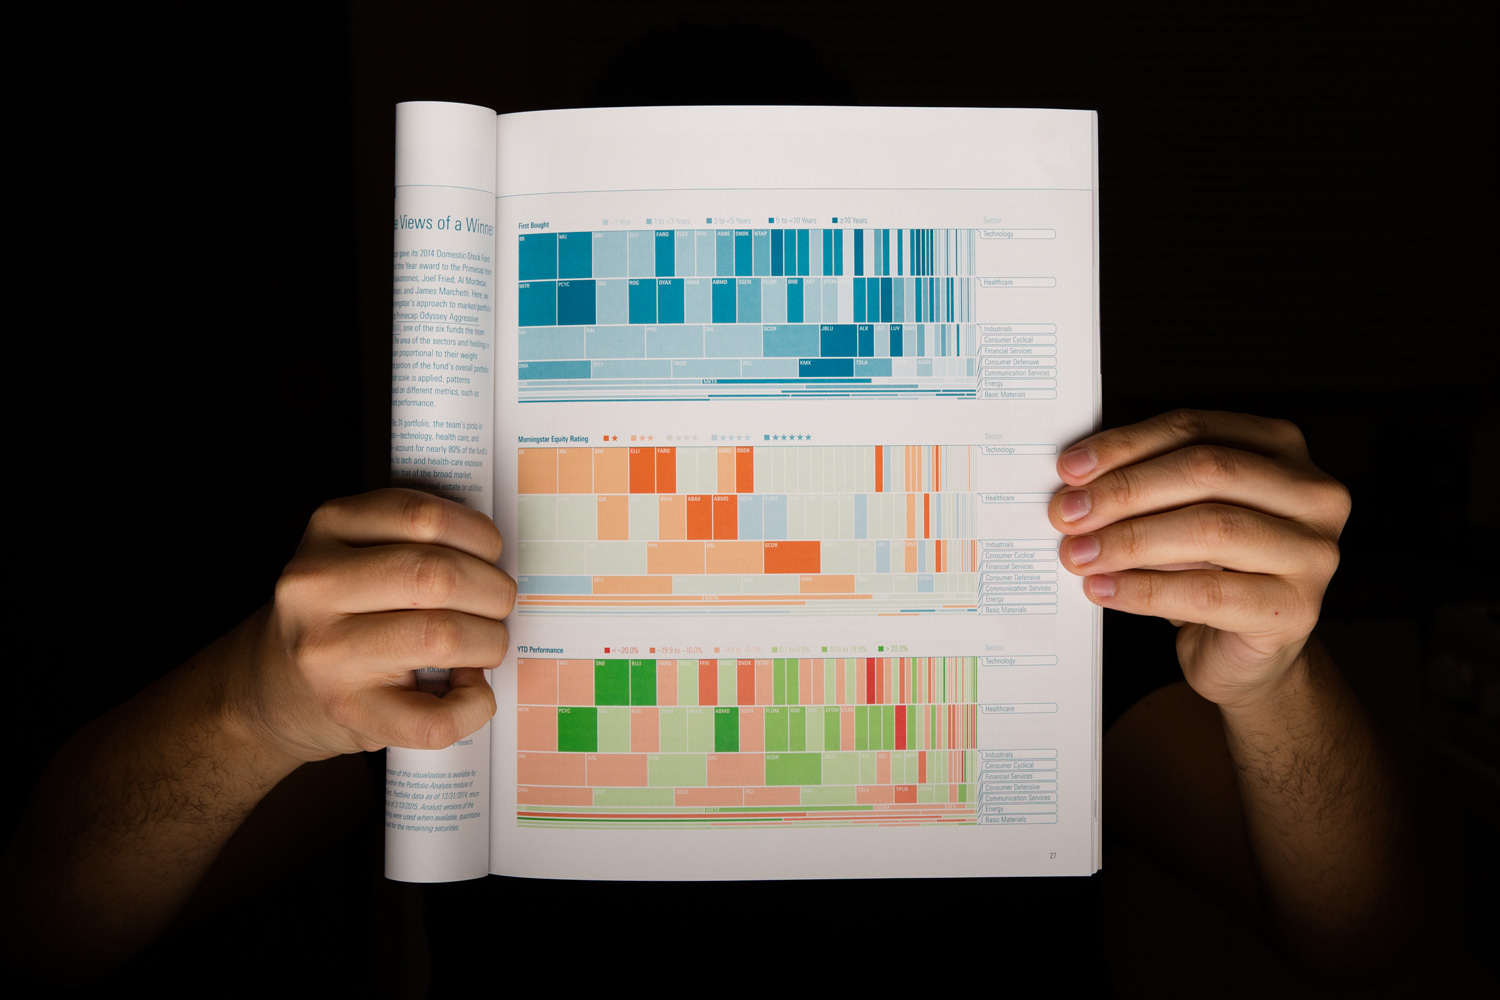
Plotting a portfolio’s underlying holdings by weighting and sector allows for a dynamic view of the main drivers of a fund’s composition.
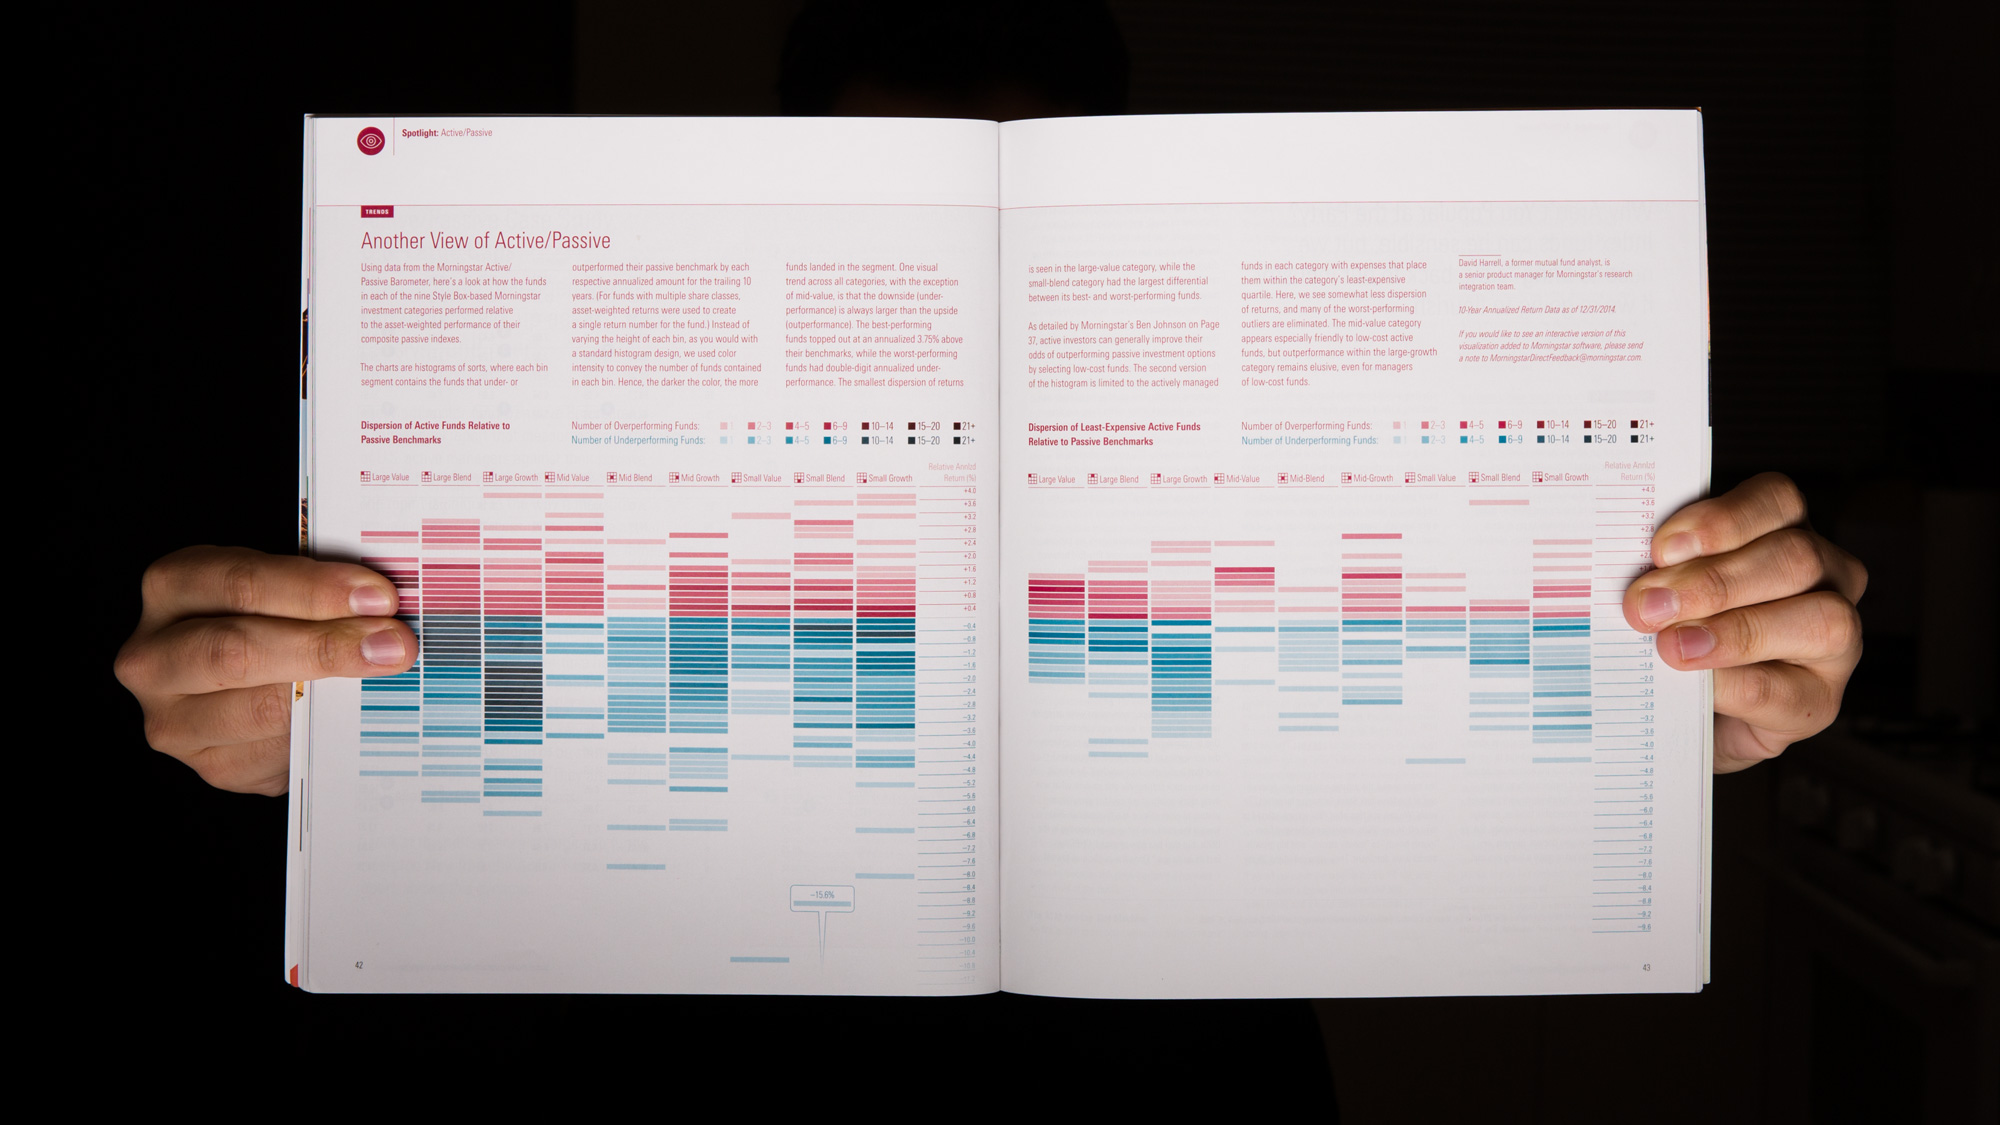
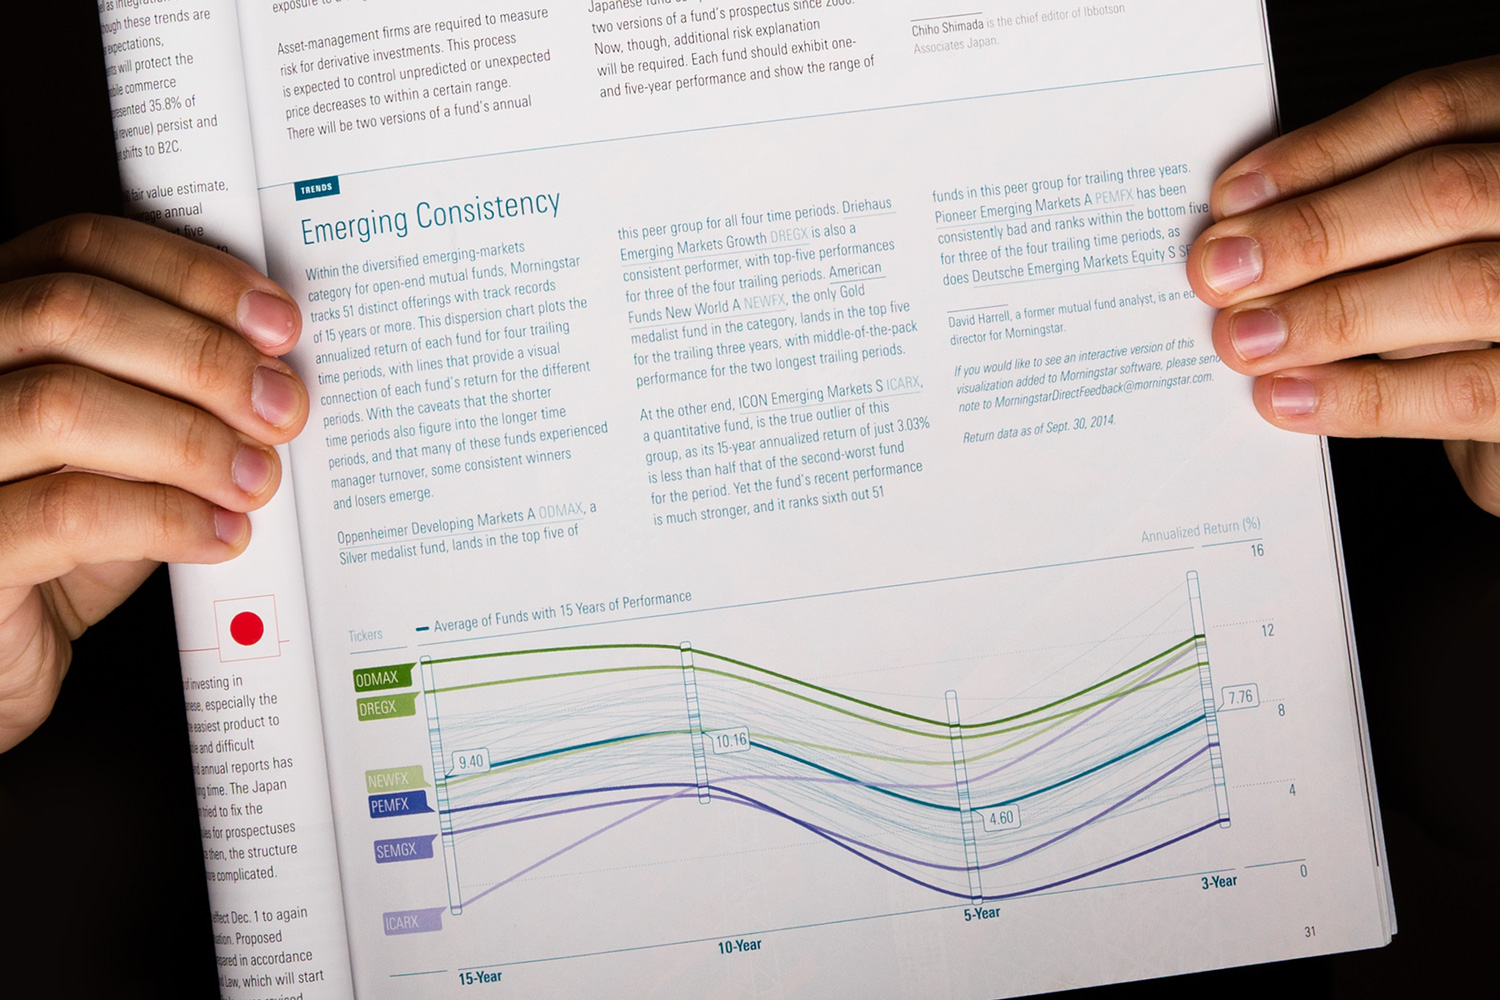
An extreme outlier allowed for a playful moment at the bottom of the page to preserve the legibility of the dispersion data.
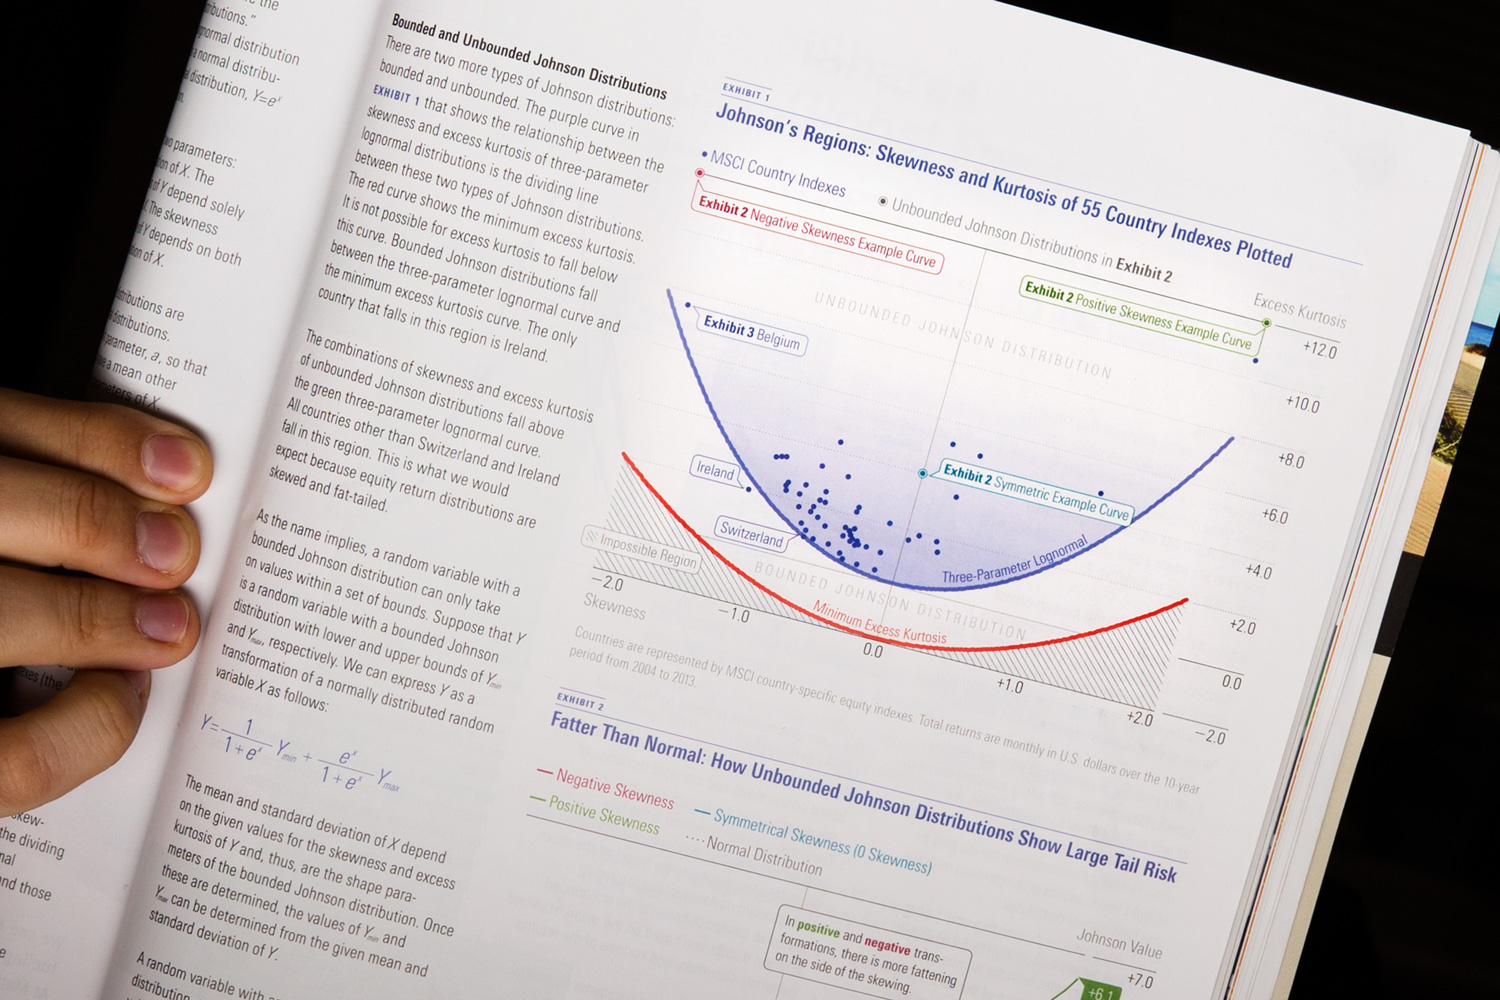
Separation of multiple layers of micro/macro information to strengthen data density.
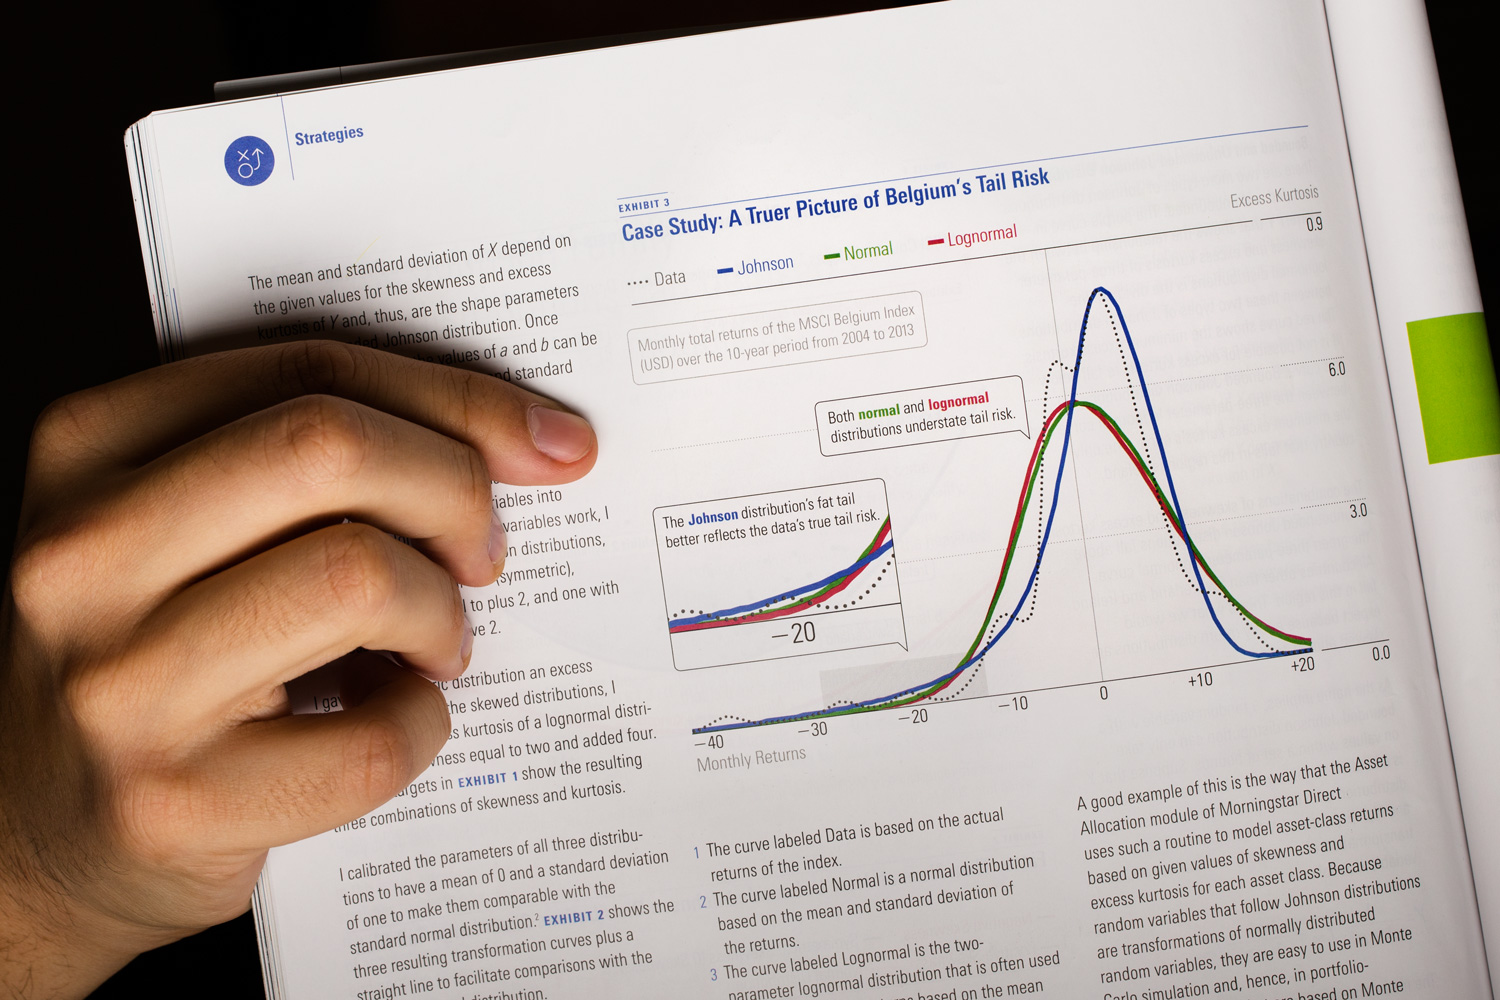
Implementation of editorial cues directly on the chart helps further deeper comprehension.
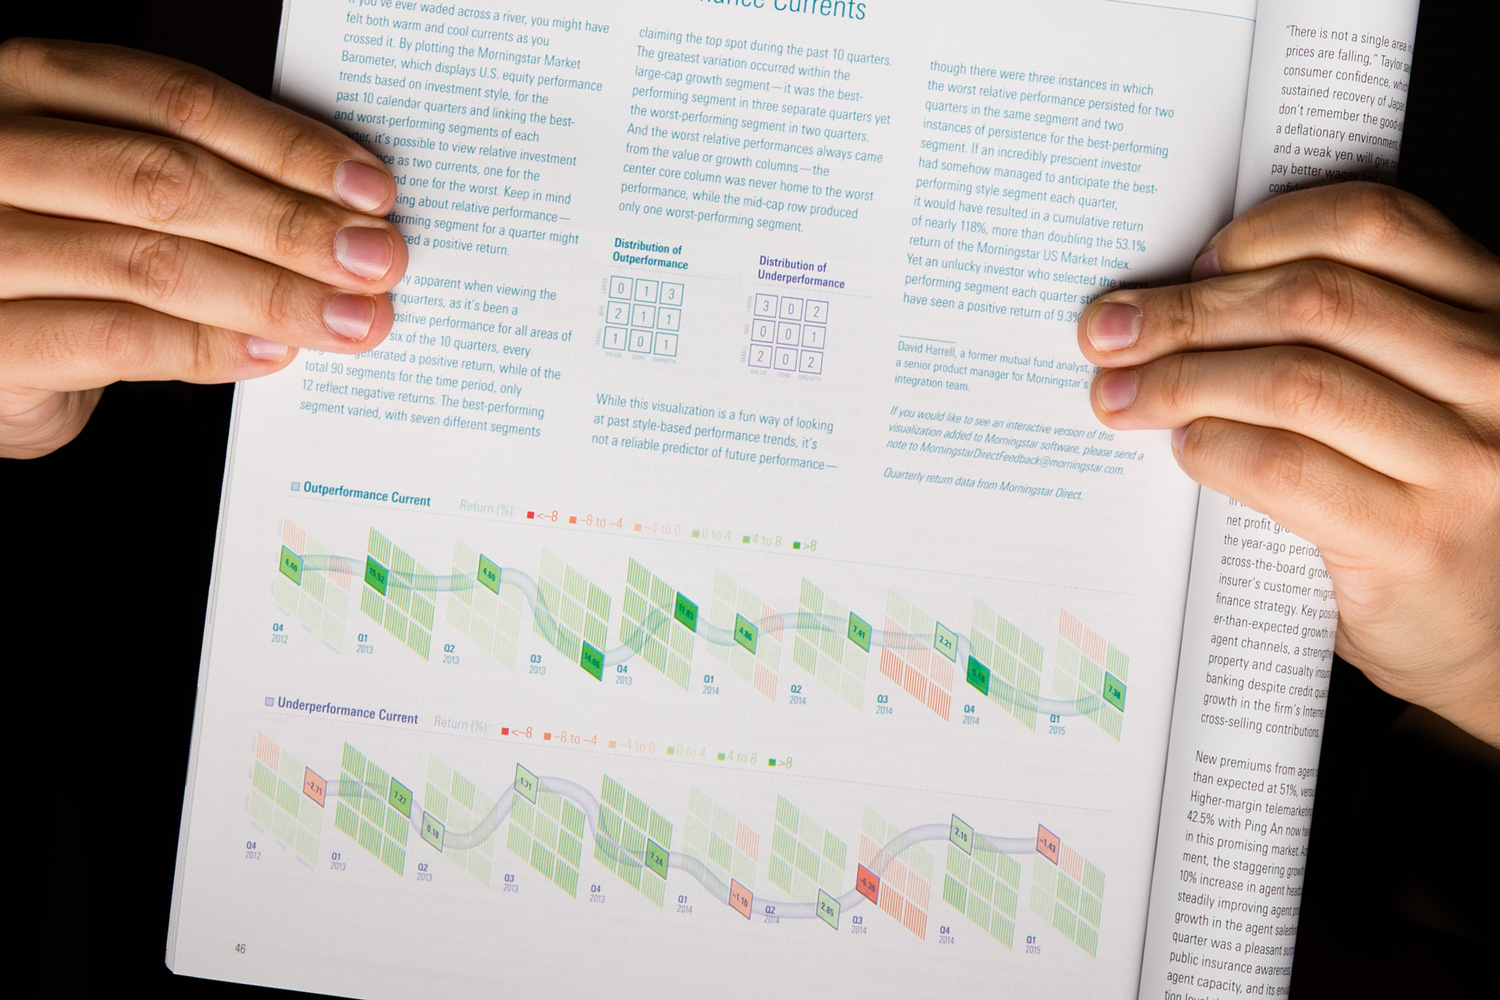
Tracking the quarterly flow of optimal (and sub-optimal) market performance by market cap and investment style.
Tracking performance trends of six emerging-market funds while maintaining the context of their peer group of qualified funds.
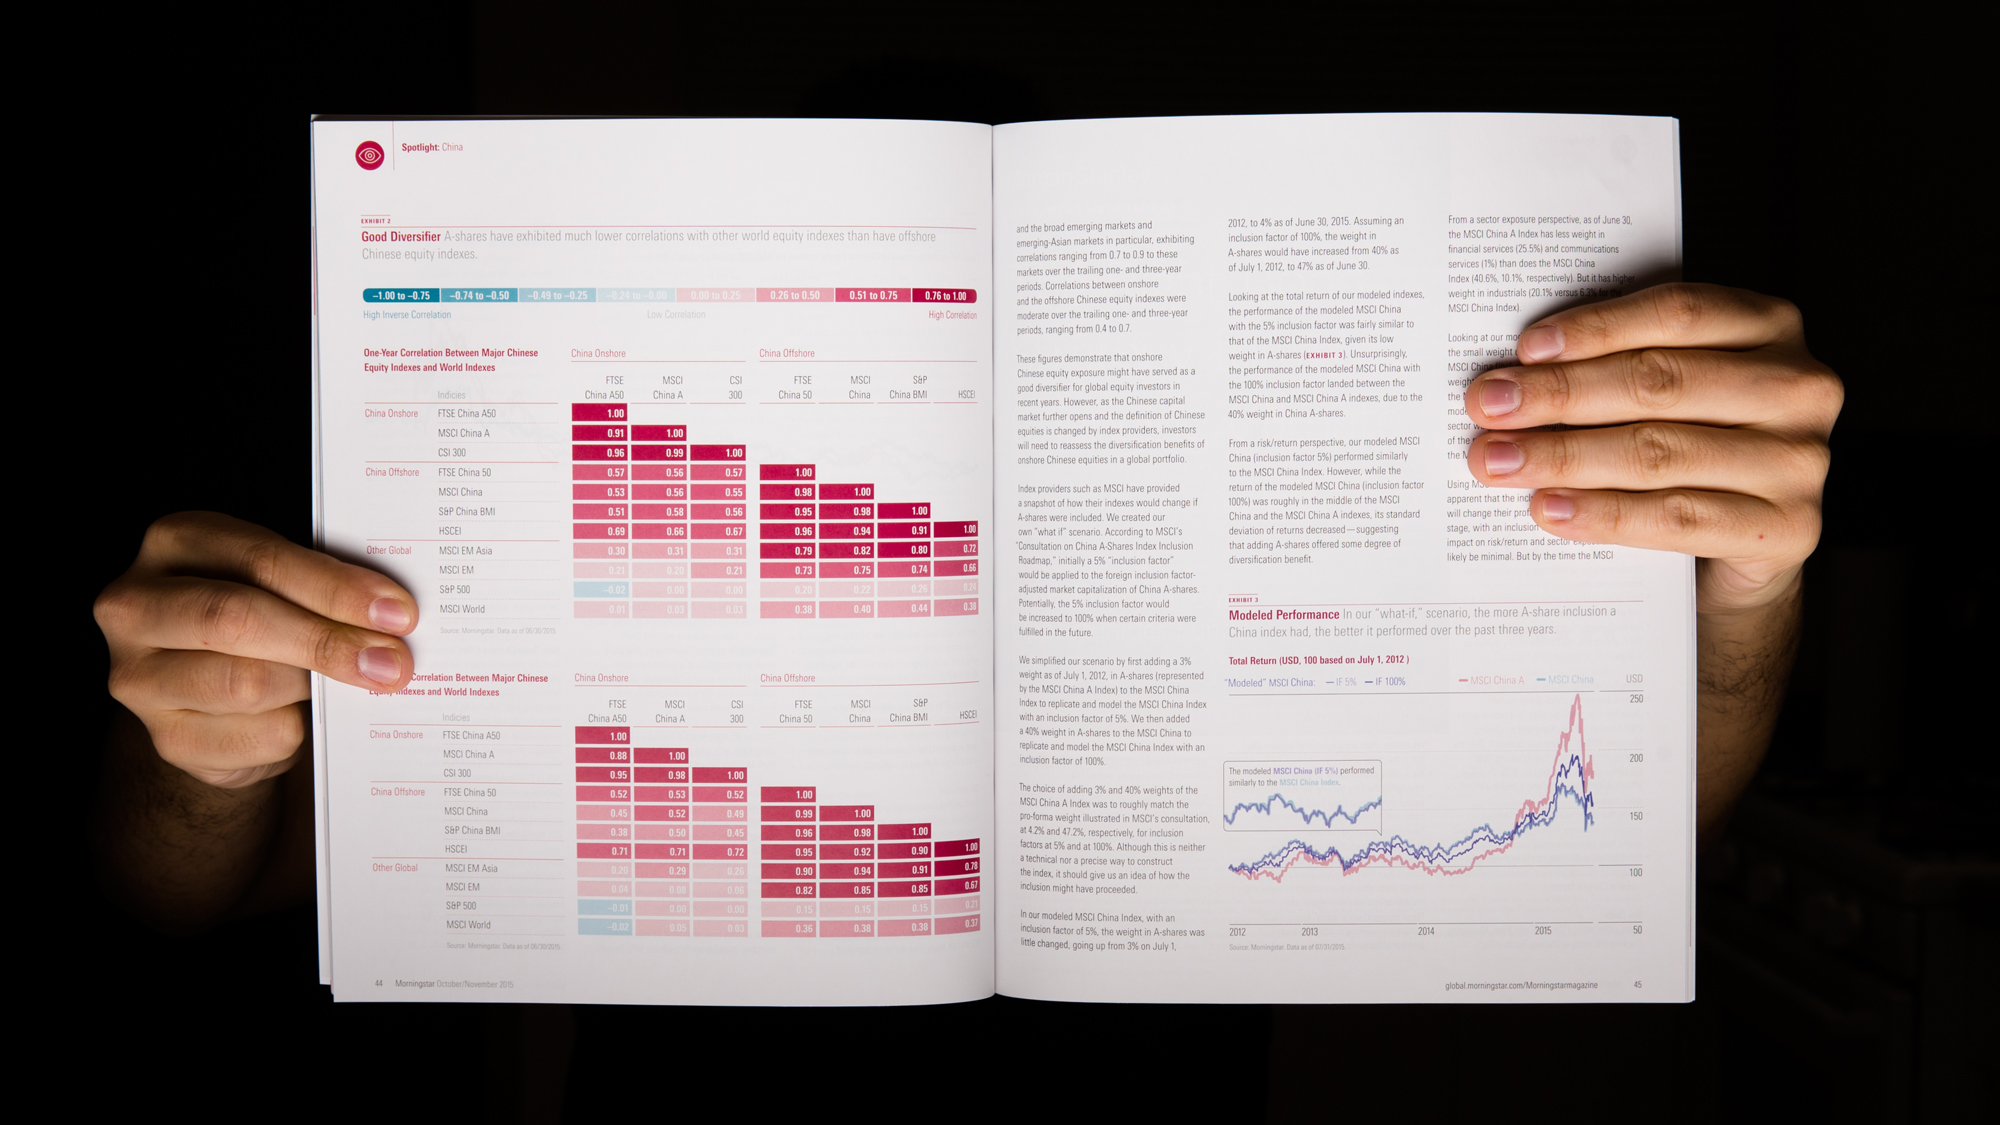
Spotlight was a rotating bimonthly topic that offered an opportunity for rich, interconnected data density throughout its articles.
An investigation into emerging-markets fund composition by comparing the regional exposure of three key funds to the category benchmark.